How to represent the Islas Malvinas in R and QGIS
A discussion on the Islas Malvinas in the OpenStreetMap basemap and tutorials to use the Argentinean official cartography of the Instituto Geográfico Nacional
Motivation
The Islas Malvinas are Argentinians. In digital maps, the Islas Malvinas are often mislabeled with an incorrect name, no consistent with our historical and current sovereignty claim. Why do some Argentinean people produce maps with a name different to “Islas Malvinas”? When discussing this issue with peers, I found people that:
- Haven’t noted the mistake, but want to solve it and can solve it when the error is pointed out.
- Haven’t noted the mistake, want to solve it but don’t have enough technical skills to do it.
- Justify the mistake because, they say, their maps are in English. However, the only translation of “Islas Malvinas” into English is “Malvinas Islands” (e.g., see this document). Using the name imposed by English occupants or using a binomy (Argentinian name / English name) implies a setback in our sovereignty claim over the islands.
Maps are a powerful tool for political communication: they allow us to express our visions of the territory. I consider it inadmissible that the Islas Malvinas have an incorrect name in the maps that Argentineans produce, as well as in the publications edited in the country. Our patriotic claim to exercise sovereignty over the islands cannot be undermined by errors in the representations of the territory. Using the names that that try to impose those who illegally usurp the island territories of the Province “Tierra del Fuego, Antártida e Islas del Atlántico Sur”, is also an offense to our fallen soldiers in the attempts to recover the Islands. For these reasons, I’d like to spread these issues so that more people can solve their problems of representation of the Malvinas Islands in the cartography generated with digital tools.
Who is this document for?
This document is aimed at those who want to make maps in R or QGIS (two open-source software environments) and who understand Argentina’s claim to exercise sovereignty over the Islas Malvinas.
Also, the document is aimed at those who already know the Argenmap v2 basemap of the Instituto Geográfico Nacional and want to promote its use in R or QGIS.
Although I do not provide an explicit solution for Python or other open-source sofwares/languages1, I invite contributions: possibly some of what is documented here may be useful. The solution provided for QGIS, based on XYZ tiles, can likely be used in privative GIS softwares. The Github repository is available at: https://github.com/nmorandeira/IGN_Malvinas.
This documents includes a discussion on the origin of the Islas Malvinas representation problem and some tools to solve it. If you are only interested in the practical solution, you may skip the next section on the origin of the problem and jump to the sections R tutorial or QGIS tutorial.
1 Update with HTML contribution: on August 13th 2020, José Mourglia contributed with template files for webpages (HTML Leaflet + Java + CSS). His contribution is included in the repository associated to this post.
Acknowledgements
This document was written in July 2020. Malena Libman (Geochicas OSM) collaborating by pointing out which is the solution: to use Argenmap v2 as basemap, a great work ellaborated by the Instituto Geográfico Nacional (IGN, National Geographic Institute) of the República Argentina.
Thanks to the contribution of José Mourglia (Subsecretaría de Sistemas y Tecnologías de Información, Ministerio de Hacienda y Finanzas, Provincia de Corrientes), who contributed with template files to use the Argenmap basemap in webpages (HTML + Java + CSS).
Thanks to Priscilla Minotti for her comments and suggestions, which improved the R script, and for suggesting to write the stript in RMarkdown; thanks to Yanina Bellini for her help to publish this post in a web site and also to R-Ladies (Buenos Aires, Santa Rosa and General Pico) for several meetups and for help with Rmd and Git. Lastly, I’m grateful to Santiago Mouradian, Facundo Daelli and José Hernández for our fruitful discussions that improved this document.
Problem origin
Two problem types occur when representing the Malvinas Islands, both of them related to the origin of the geographic data. The solutions here provided include using the official Argentinian geographic data, ellaborated and published by the Instituto Geográfico Nacional.
The problem of the source of vectorial layers
The geographic data with vectorial representation (or “vectorial data”) represent mainly points, lines or polygons. If we want to produce a thematic map with information about Argentina, in with we represent a variable with different colour values or tones in each Province, we may use a polygon vector layer (“Argentinian provinces”). Then, we should be careful with the origin of the layer: if the Province “Tierra del Fuego, Antártida e Islas del Atlántico Sur” is incomplete (without the Islas Malvinas), our Argentinian map would be incomplete.
Other example is the use of a global map, with all the countries, in which we want to assign each country a color according to a variable value (take the case of the Covid-19 epidemic maps). What happens if the label of the Islas Malvinas polygon does not say it belongs to Argentina? Our territory map would be incomplete too.
Solution to the problem of the vectorial layer origin
- The Instituto Geográfico Nacional publishes the official geographic information of Argentina, freely available at the site IGN SIG Layers. We may be interested in the polygon layers “País” (country polygon, Argentina), “Provincia” (multiple polygons layers of the Provinces) or “Departamento” (múltiples polígonos correspondientes a los departamentos).
- Regarding global layers, they are not available at IGN. The most common issue is that the Islas Malvinas are usually mislabelled in global country layers. In that case, we may edit the attribute table and change the polygon name in the field belonging to country and/or province. This document does not aim to explain how to edit a vectorial layer, but the procedure is relatively easy and I may help anyone having difficulties with this task (several solutions are available in R; in QGIS, check the section “Working with the Attribute Table” of the QGIS Training Manual).
The problem of the basemap providers
When representing spatial data (vectorial or raster) it’s necessary to use a basemap, i.e., to include information on the geographic location of our interest area. We may generate our own basemap including basic cartographic information such as cities, political limits, watercourses, etc. Basemaps are also available through tile providers: we cannot modify the information given, and usually we don’t need as much detail as is included in these tiles.
Both in QGIS and in R (in Leaflet representations), we use as basemaps those from OpenStreetMap (OSM) or other providers. In QGIS, the XYZ tiles option is used; in R, we import these tiles through Leaflet providers. The tiles are images that render according to the scale or zoom level; and are uploaded in the server of the providers: since we cannot modify their content, we may choose to use them or not.
There are several Leaflet providers (see below, spoiler: none of the usually listed says “Islas Malvinas” or “Malvinas Islands”). I’ll focus on OSM because a) it’s one of the most widely used; b) people or sofware use it by default; c) it’s open source, a great advantage in comparison to other providers: we may download information, use OSM maps in our publications, and also contribute by mapping (as a lot of people do in Argentina!). However, OSM is a global project and the core does not accompany our sovereignty claim.
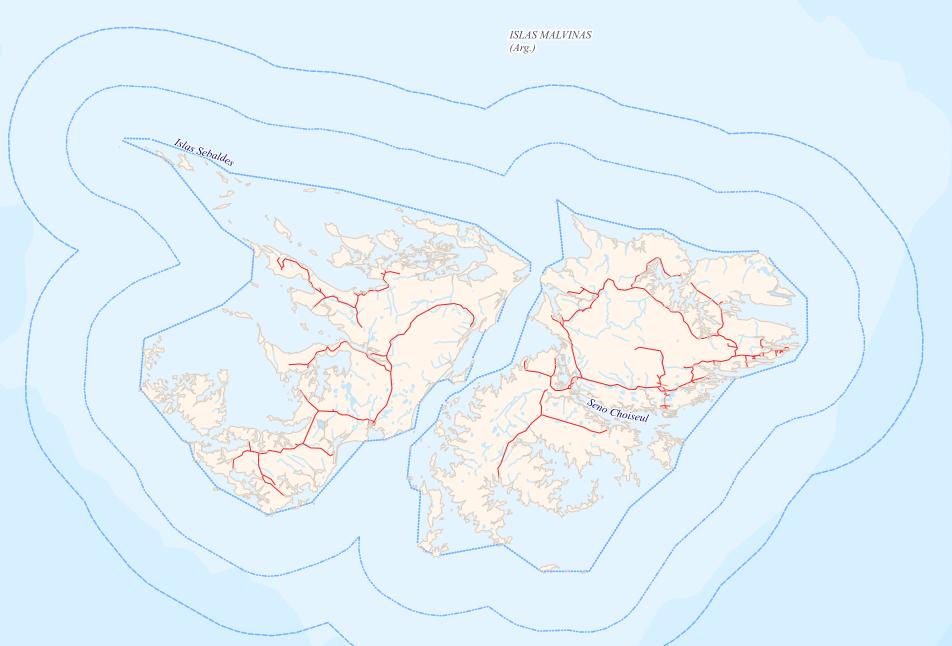
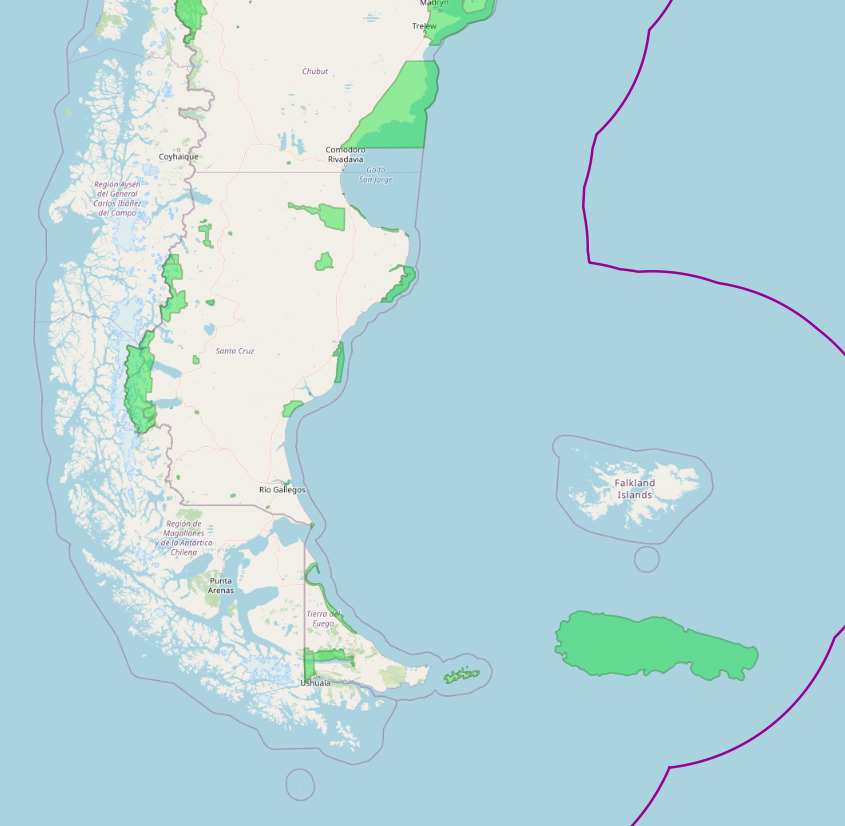
How are displayed the Islas Malvinas in the OSM maps? (default option in R Leaflet and in QGIS). Like this.
By default, OSM represents the names in the “local language” (for example, the names of the localities in Brazil are in Portuguese, and the names of the localities in China are in Chinese). The Islas Malvinas are labeled “Falkland Islands” because they are assigned by OSM to the “British Overseas Territories”. Here is the detail of the information associated to the OSM Relation 2185374, corresponding to the Islas Malvinas territory. The items more relevant to our discussion are copied and commented below:
| OSM Relation 218537 | Commment |
|---|---|
 |
The name assigned to the relation 2185374 points the problem. |
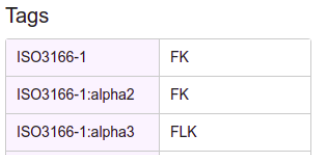 |
Some labels. Guess the meaning of FK. |
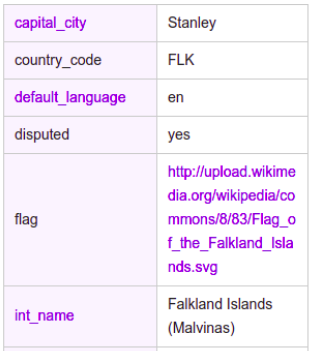 |
OSM says: the capital is Stanley (¿Puerto Argentino?), the default language is English. Are these disputed territories? Yes. But the flag belongs to an English location; and the international name is “Falkland Islands (Malvinas)” (as pointed below, this would be the United Nations Convention, but it’s not the default shown label). |
 |
The “name” label is the most important: this is how the islands are named by default in any map we render. Here is our mapping problem. |
 |
The “name:es” label might be a partial solution. It means: “name in Spanish”. I’ll comment on this below. |
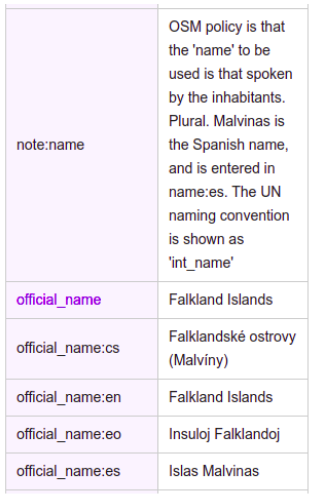 |
In this screenshot, I’d like to highlight the note, because it was pointed to me by the OSM community. The note says: “OSM policy is that the ‘name’ to be used is that spoken by the inhabitants. Plural. Malvinas is the Spanish name, and is entered in name:es. The UN convention is shown as ‘int_name’.”. However, this note ignores at least two issues: 1) There is a sovereignty claim, not a translation conflict: the only possible translation of Islas Malvinas to English is Malvinas Islands; 2) The official language in Argentina is Spanish (castellano). Besides, why OSM –that recognizes there is a disputed territory– consider more convenient to use “name” and not (at least) the “int_name” from the UN convention? |
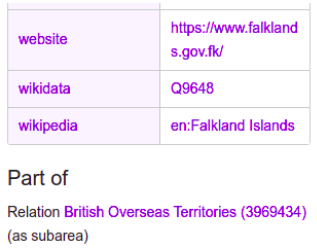 |
More information on the information source associated to the object. A curious fact: the relation is part of the “British Overseas Territories”, which seem to be occupied territories and colonies all over the world. |
Partial solutions to the basemap problem
A partial solution would be to use the label name:es by default in our maps. This would imply using the Spanish labels not only for the Islas Malvinas but also for any location in the world, including Brazil and China (following our previous example). This doesn’t solve the underlying problem of how OSM positions itself in the face of the conflict, but would be a partial solution. However, this is not easy for end users (to whom this document is intended for).
An advantage of OSM being free and open-source is that data can be downloaded and re-loaded in other servers, as OSM-Argentina has done. In this way, OSM Argentina could solve some of the problems (the label of the islands), but not others (city names and geographical accidents).
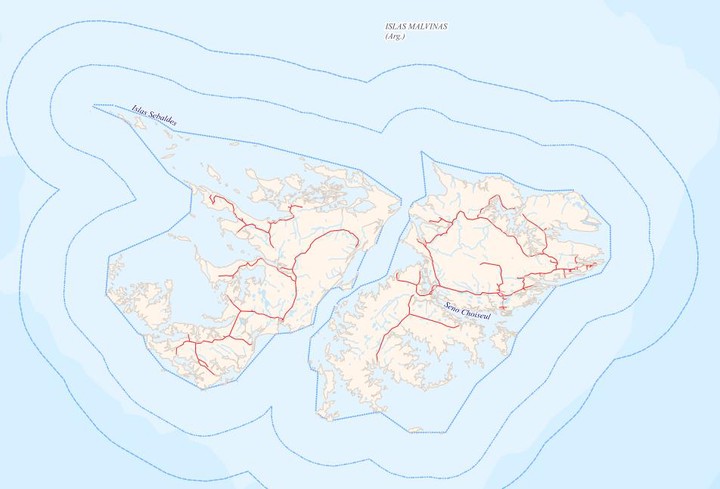
On the other hand, the Instituto Geográfico Nacional (IGN) truly solves the issue: Argenmap v2 correctly represents the official toponymy of the jurisdictions and geographical accidents in Argentina. Here is documentation on the information displayed by Argenmap, it mainly “uses the official data published by the Instituto Geográfico Nacional through its WMS service, at a 1:250,000 scale (i.e., from zoom level 12)”. Here you can see how are represented the Islas Malvinas. Not only the name of the islands is correct, but also the name of the Province “Provincia de Tierra del Fuego, Antártida e Islas del Atlántico Sur”. And also the name of rivers, lakes, mounts, etc (zoom in the islands, or –why not– any other area you are familiar with, for example the official names of the shallow lakes is shown in the Paraná River floodplain). Detailed information on the official toponymy of the Islas Malvinas is available.
Conclusion
Using Argenmap v2 from IGN is the best solution for our problem of representation of the Islas Malvinas originated by Leaflet providers.
Protocols for using the Argenmap v2 basemap
Case study exercise
To practice visualizing geographic data with R and QGIS, I propose a case study exercise. The aim is to represent the natural protected areas in Argentina and the exclusive economic zone limites (both layers are available in IGN), with a accurate basemap. In particular, we aim to represent the Natural Protected area Banco Burwood II and its surroundings.
R Protocol
Using Argenmap v2 (IGN) as basemap, with Leaflet
The first step is to optain the vectorial layers (natural protected areas and exclusive economic zone) from the official IGN site, and unzipping them:
protectedareas <- tempfile()
download.file("http://ramsac.ign.gob.ar/operaciones_sig/shp_from_geoserver/download.php?f=c2hwOjphcmVhX3Byb3RlZ2lkYS56aXA%3D",areasprotegidas, mode="w")
unzip(protectedareas, exdir = "data/")

limit_EEZ <- tempfile()
download.file("http://ramsac.ign.gob.ar/operaciones_sig/shp_from_geoserver/download.php?f=c2hwOjpsaW5lYV9kZV9saW1pdGVfMDcwMTA3LnppcA%3D%3D",limite_ZEE, mode="w")
unzip(limit_EEZ, exdir = "data/")
These two layers are vectorial shapefiles, a polygon and a line layer. Now we read it in R, as spatial objects. Remember to install the packages used in the next code chunks.
library(sf)
protectedareas <- st_read("data/area_protegida.shp", quiet=TRUE)
limit_EEZ <- st_read("data/linea_de_limite_070107.shp", quiet=TRUE)
To visualize these layers in a map, we may use the library tmap and the interactive mode view. We first configure the output mode.
library(tmap)
tmap_mode("view")
Now we obtain the map with tmap (a usual way in R).
map <- tm_shape(protectedareas) +
  tm_polygons(col="green") +
  tm_shape(limit_EEZ) +
  tm_lines(col="violet")
map
The code generates an interactive map. You can try it in your computer. Here I provide a screenshot. Next maps render more quickly, so you will be able to interact.
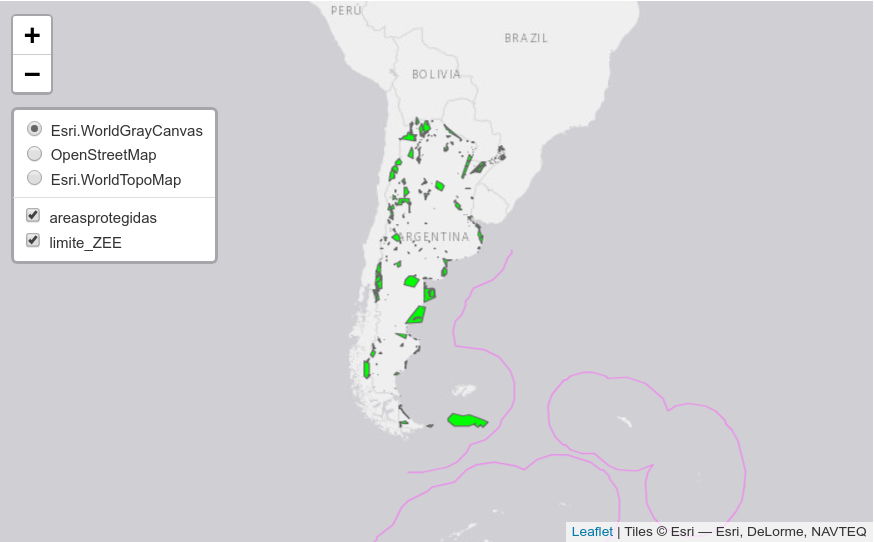
In the bottom right, the information of the Leaflet provider is seen. The provider can be changed with the layer selector (up right button): we are able to choose between three providers. OSM is one of the providers, it’s open-source but says “Falkland Islands”. The other two options are ESRI providers, with few labels at particular scales. Be aware that ESRI basemaps are not open-source, check the license terms if you want to use an ESRI map in a publication or for commercial uses.
Now we will generate the same map but using Leaflet syntaxis (instead of tmap), because we will be allowed to modify the basemap provider. There are a lot of basemap providers, which can be added in Leaflet using the command “addProviderTiles”. Here is a list and previsualization of the available Leaflet providers: https://leaflet-extras.github.io/leaflet-providers/preview/. We load the two needed libraries:
library(leaflet)
library(htmltools)
Example with the OSM basemap, which is usually the default option in tmap and is adequate for other regions of Argentina:
basemap_1 <-leaflet() %>%
  addProviderTiles("OpenStreetMap.Mapnik")  %>%
  setView(-60,-50, zoom = 5)
basemap_1
Other example, with the provider “Stamen Toner”:
basemap_2 <-leaflet() %>%
  addProviderTiles("Stamen.Toner")  %>%
  setView(-60,-50, zoom = 5)
basemap_2
The problem is that NONE of the providers in the extensive list would show “Islas Malvinas”. So, we need to include Argenmap v2 from IGN! To load the IGN tiles, we use addTiles (instead of addProviderTiles), and we need to know the link to those tiles. This chunk code creates an object called basemap_IGN.
basemap_IGN <-leaflet() %>%
  addTiles('http://wms.ign.gob.ar/geoserver/gwc/service/tms/1.0.0/capabaseargenmap@EPSG:3857@png/{z}/{x}/{-y}.png',
           attribution = "Argenmap v2 - Instituto Geográfico Nacional") %>%
  setView(-60,-50, zoom = 5)
basemap_IGN
Now we finally see how Argenmap v2 solves our problem of representation of the Islas Malvinas, as well as the name of the Province and of other toponymy issues.
Having the basemap_IGN, we will add the vector layers using the pipe %>%. In the natural protected polygon layer, the parameter label adds labels on each polygon, visualized with the cursor. This map may take time to load, because of the protected areas layers. But the final product worth the wait!
final_map <- basemap_IGN %>%
  addPolygons(data=protectedareas,
              col = "darkgreen",
              fillOpacity = 0.3,
              label=~htmlEscape(protectedareas$fna)) %>%
  addPolylines(data=limit_EEZ,
            col = "violet")
final_map
Ready!
QGIS 3.xx Protocol
Using the Argenmap v2 (IGN) with XYZ Tiles
The following examples are for QGIS 3.14 version (the last version available in July 2020), and may slightly change in other 3.xx versions.
In the first place, we will open the two vectorial layers used in the case study exercise. The download links of the IGN SIG layers are:
- Natural protected areas (polygons)
- Limit of the Exclusive economic zone (lines)
Download and unzip the layers. Next, add them to the QGIS layer panel with any of these methods:
- With the button “Add vector layer”,
- With the keyboard shortcut Ctrl+Shift+V,
- Menu Layer > Add layer > Add vector layer
- Drag and drop the .shp file to the layer panel, from your folder or from the QGIS Navigator panel.
We may change the layer simbologies.
To load basemaps in QGIS 3.xx, XYZ Tiles are used. For comparison purposes, we’ll display two basemaps, OpenStreepMap and IGN Argenmap v2. A lot of XYZ tiles basemaps are available, here is a useful guide.
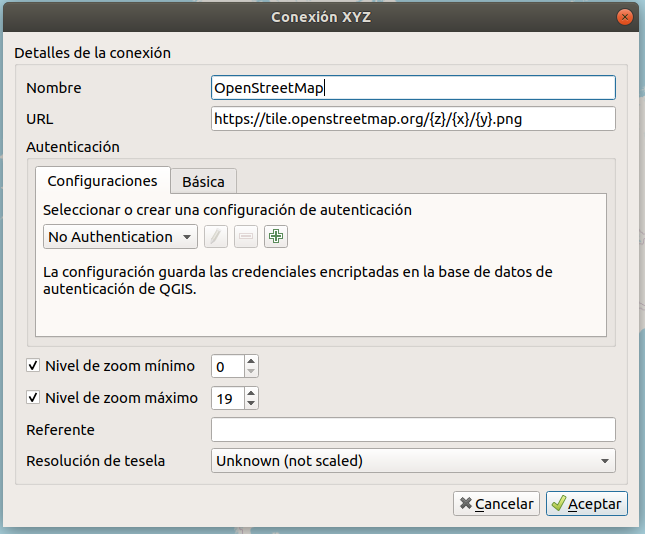
Go to the “Navigator” panel (if you don’t see it, add it: View > Panels > Navigator), search XYZ Tiles. Right click and next click “New conexion”.
The first example is for OSM. Write a name or your choice for the conection name. For the URL, copy and paste: https://tile.openstreetmap.org/%7Bz%7D/%7Bx%7D/%7By%7D.png. Leave the other options as default.
Next, we may display the OSM basemap by double-clicking the XYZ layer or drag-dropping it from the Navigator panel to the Layer panel. Move the basemap below the vectorial layers. The output will have an incorrect name in the Islas Malvinas:
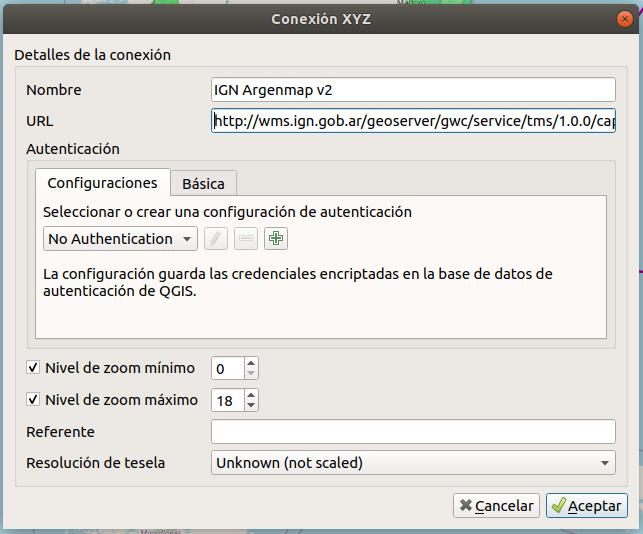
To display the IGN Argenmap v2, go back to XYZ tiles and create a new conection. The URL is http://wms.ign.gob.ar/geoserver/gwc/service/tms/1.0.0/capabaseargenmap@EPSG:3857@png/{z}/{x}/{-y}.png.
Here is the desired map:
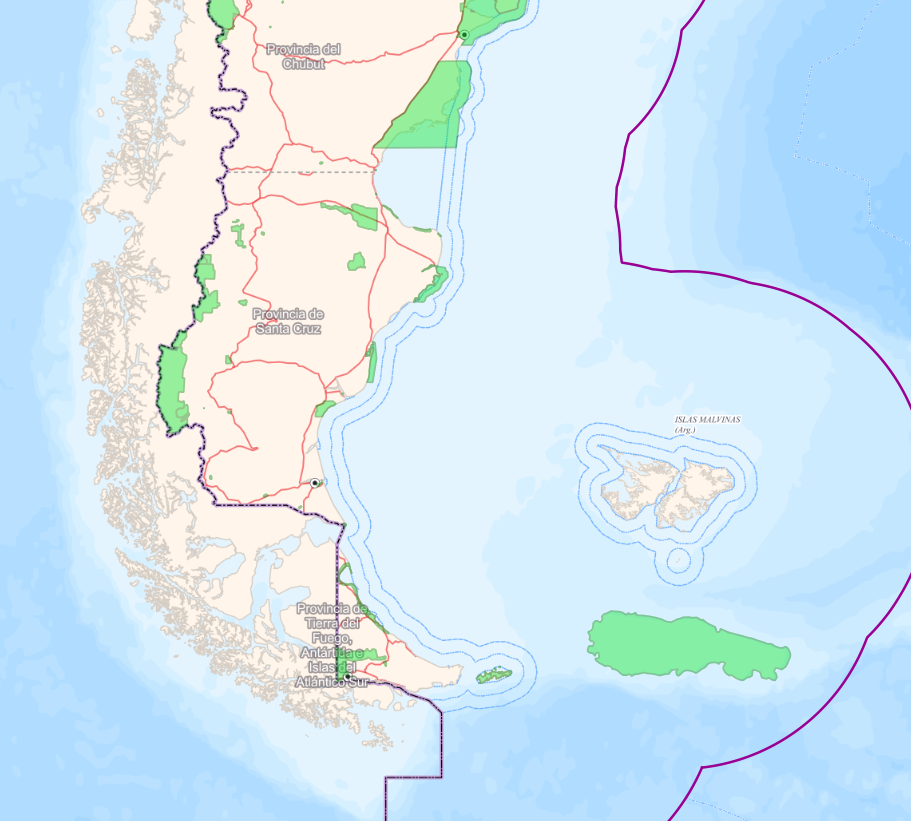 Ready!
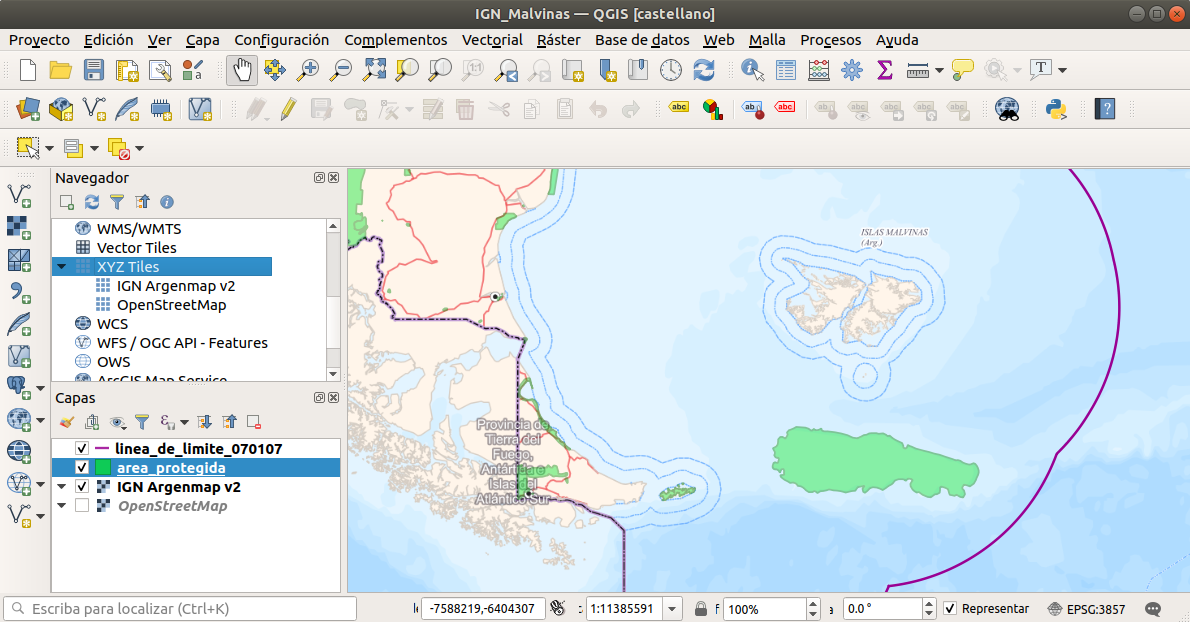
Here is the QGIS project of this exercise. A general view of the project view and the XYZ layers in the Navigator and Layer panels is:
Repository suggested citation
Morandeira, NS.
- Uso de cartografía oficial del Instituto Geográfico Nacional para representar a las Islas Malvinas en R y QGIS. v.1.0.0. DOI: 10.5281/zenodo.3972477
![]()
Natalia Morandeira
Adjunct Researcher
I’m a biologist, specialized in Landscape Ecology, Plant Ecology & Remote Sensing. I’m also a fiction writer.